Get started in a minute
Shimoku allows you to start creating without registration and with just a step

pip install shimoku-api-python

copy
Ready! Visit our documentation to get started building and our site to get to start in localhost.
Play and growth!
Build Web Apps like a whole IT team in one
If you want to create a whole Startup you can do it now with pure Python, best UI in town to create the Web Apps with best User Experience with Python.
No IT required, just Python
White label
Customize every aspect of the user interface to match your corporate brand, from color themes and custom fonts to CSS overrides and even the login screen image. Take complete control of your users' digital experience and make it seamless.
Start Now
Embed predictive analytics
With few lines of Python any junior Python Data developer can create a page that you can embed in another Software like a whole fullstack IT team would. You can also shared it with the community as a shared link!
Start Now
Real time
With Shimoku you can update data in miliseconds and see it updating instantly in the Front End.
Start Now
More than analytics, end-to-end AI analytics
Shimoku allows in a single line of code add predictions to line charts, or find anomalies that you can draw and embed through a single tool thought for non experts junior python developers
Start Now
State of the art components
Use REACT components directly from Python, from eCharts to many others REACT libraries. Almost a hundred components to easily and efficiently build and deploy a whole software.
World class visuals and charts
Unmatched Diversity of Graphics
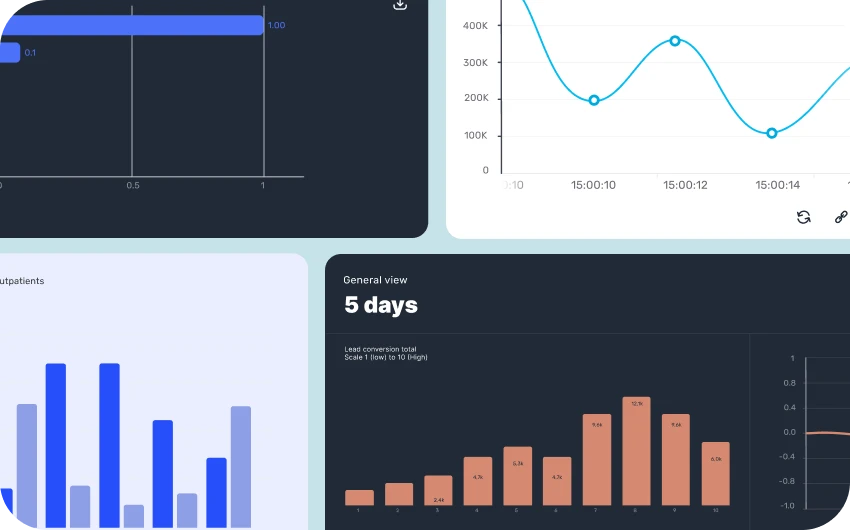
Every data set is unique, and Shimoku understands that. Whether you need a classic Linechart or are looking for more stylish variants, we've got you covered. But we don't stop there.

With Shimoku, you can also dive into a wide variety of visualizations, from Barcharts to Heatmaps, each precisely designed to tell the story of your data.
Start Now
Unmatched Diversity of Graphics
Every data set is unique, and Shimoku understands that. Whether you need a classic Linechart or are looking for more stylish variants, we've got you covered. But we don't stop there.

With Shimoku, you can also dive into a wide variety of visualizations, from Barcharts to Heatmaps, each precisely designed to tell the story of your data.
Start free
Create account
for free
Get inspired by these stories.
Would you like to see one of our products live?Create your free account and explore all the potential.
Get started for free